A HERE CITY site

Illinois Corn Yield Falls 17 Bushels Below Trend, the Biggest Gap Since the 2012 Drought
USDA's 200-bushel Illinois corn forecast is 17 bushels under trend, the largest miss since 2012, while Iowa, Minnesota and Ohio run above trend.
Key takeaways
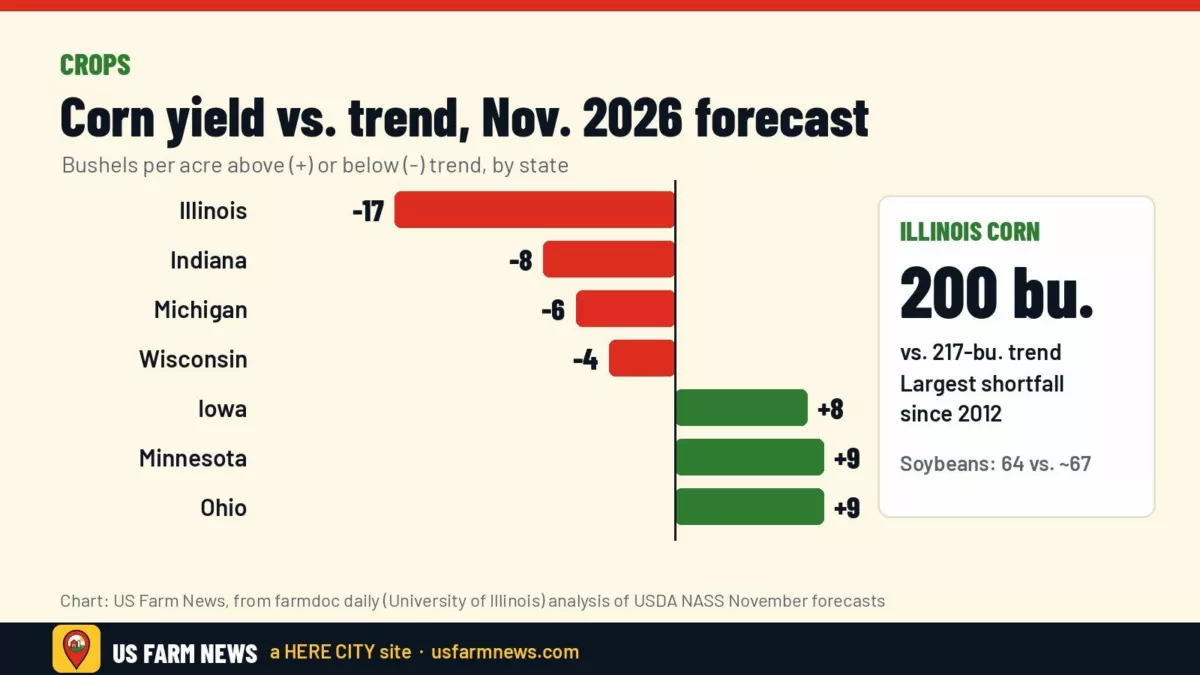
- USDA’s November forecast puts the Illinois corn yield at 200 bushels an acre, about 17 bushels under the 2026 trend of 217, according to farmdoc daily.
- That roughly 8% shortfall is the state’s biggest miss against trend since the 2012 drought, the University of Illinois economists said.
- Illinois soybeans are forecast at 64 bushels, about 2.9 bushels under trend, while Iowa, Minnesota and Ohio are above trend for both crops.
- NASS publishes final 2026 yields in January 2027, and they could change the picture.
Illinois, the No. 2 corn state in USDA’s November production table behind Iowa, is heading for its weakest corn yield against expectations in more than a decade. An analysis published Tuesday by farmdoc daily at the University of Illinois found that USDA’s November forecast leaves the state’s corn crop 17 bushels an acre below its long-run trend. That is the largest gap since the 2012 drought.
The numbers line up with what many Illinois growers have been saying all fall: the combine monitor came in under what they had budgeted. With the state’s corn harvest 96% complete as of Nov. 15, matching the five-year average in USDA’s Crop Progress report, most of those bushels are already in the bin or at the elevator.
What the November numbers show
USDA’s National Agricultural Statistics Service (NASS) cut its Illinois corn forecast to 200 bushels an acre in the Nov. 10 Crop Production report, down from 208 in October and well below the 214 bushels harvested in 2025. NASS put Illinois corn production at 2.19 billion bushels on 10.95 million harvested acres, compared with 2.34 billion bushels a year earlier.
farmdoc daily estimates trend yield by fitting a straight line through the previous 20 years of yields and projecting it forward. By that method the 2026 Illinois corn trend is 217 bushels, so the November forecast lands about 8% short. In 2012, the state’s corn yield came in roughly 68 bushels, or 39%, under trend, so this year’s miss is much smaller than that disaster. But it is large compared with anything Illinois has seen since.
- Illinois corn: 200 bu./acre forecast vs. a 217 trend (-17)
- Illinois soybeans: 64 bu./acre forecast vs. a trend of about 67 (-2.9)
- Illinois soybeans vs. 2025: up 1.5 bushels from 62.5
- NASS October Illinois soybean forecast: 68 bu./acre, trimmed to 64 in November
A split Corn Belt
The shortfall is not a Midwest-wide story. farmdoc daily’s state comparison shows corn yields below trend in Illinois, Indiana (8 bushels under), Wisconsin (4) and Michigan (6), along with North Dakota, South Dakota and Nebraska. Iowa is forecast 8 bushels above trend, and Minnesota and Ohio are each 9 bushels above.
NASS’s state table shows the same pattern. Iowa’s corn forecast held at 219 bushels an acre from October to November, Ohio held at 200, and Minnesota rose to 204 from 195. Nebraska slipped to 184 from 188.
Soybeans are mixed too. Iowa, Minnesota and Ohio are above trend by 3.2, 3.3 and 5.2 bushels, respectively, according to the analysis. Indiana, Michigan and Nebraska have soybean yields above trend even though their corn is below it. Illinois, Wisconsin and the Dakotas are under trend for both crops.
Even inside Illinois the results vary widely. The University of Illinois economists noted that reports from southern Illinois describe an exceptional year, while northern and central parts of the state point to lower yields. A statewide average will hide those differences.
What it means for farm income
At any given price, fewer bushels mean less crop revenue than a farm would have earned at trend yields, the farmdoc daily authors wrote. The real hit on any single operation will come down to its own bushels, the prices it locked in or received, its cost structure, and whatever insurance or program money it collects.
Crop insurance is part of that math this year. The 2026 harvest prices, set from October futures, are $4.75 for corn and $12.63 for soybeans. Both are above the spring projected prices of $4.62 and $11.09, farmdoc daily reported earlier this month. With harvest prices above projected prices, a farm needs an actual yield loss below its guarantee to collect on Revenue Protection, Yield Protection or area-based plans. Revenue Protection builds its guarantee on the higher harvest price, so it pays more than the harvest-price-exclusion version. Farms with yields well under their actual production history are the ones most likely to have a claim. Our guide to 2026 harvest prices and claims walks through the triggers.
USDA’s November report also lowered the national corn crop, which we covered in our November WASDE breakdown.
What to watch
- Dec. 10: USDA’s next Crop Production and WASDE reports.
- January 2027: NASS Crop Production Annual Summary with final 2026 yields, which may differ from the November forecast.
- Claims: Check your crop insurance policy’s notice-of-loss deadlines with your agent if your yields fall below your guarantee.
Frequently asked questions
How far below trend is the 2026 Illinois corn yield?
USDA’s November forecast of 200 bushels an acre is about 17 bushels, or 8%, below the 217-bushel trend estimated by farmdoc daily. That would be the largest shortfall since 2012.
Which states are above trend this year?
Iowa, Minnesota and Ohio are forecast above trend for both corn and soybeans, according to farmdoc daily’s analysis of NASS data.
Are these yields final?
No. NASS will release final 2026 yield estimates in January 2027, and they could differ from the November forecast.
Get the Daily Ag Business Briefing
Markets, policy and farm business in one free email each weekday.