A HERE CITY site

Drought Monitor: U.S. coverage falls to 44%, but the southern Corn Belt and Mid-South dry out
National drought eased to about 44% of the Lower 48, yet Kentucky, Illinois and the Mid-South worsened. Rice remains the most exposed crop.
Key takeaways
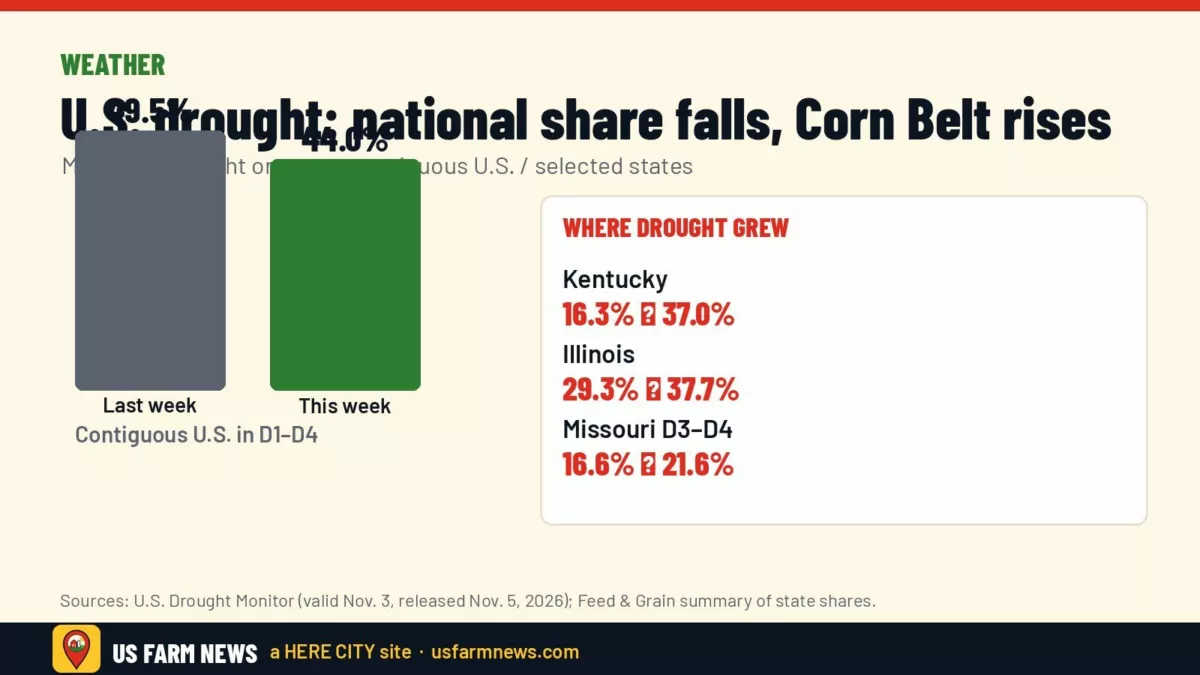
- Moderate-or-worse drought covered about 44% of the Lower 48 in the map valid Nov. 3, down from about 49.49% a week earlier.
- Minnesota improved sharply after heavy rain, while Kentucky and Illinois saw drought shares jump.
- USDA’s Agriculture in Drought summary still flags high exposure for rice, winter wheat, hay and cattle country; corn and soy exposure is lower but rising in the southern Belt.
- Forecasts favor a drier stretch through Nov. 9 and below-normal Midwest precipitation Nov. 10–14.
National drought statistics looked better on Thursday’s map, but that headline hides a split farm story. Heavy fall rain cut drought across the West, Plains and Upper Midwest, while dry, warm weather pushed problems deeper into Kentucky, Illinois and the Mid-South, according to the U.S. Drought Monitor narrative and a Feed & Grain summary of the release.
The national number vs. the field map
The Drought Monitor, valid Nov. 3 and released Nov. 5, put 43.98% of the contiguous United States in categories D1 through D4, compared with 49.49% the week before. The share in the two worst categories, D3 and D4, eased to 8.2% from 9.36%, Feed & Grain reported from the map statistics.
Author Brad Pugh of NOAA’s Climate Prediction Center wrote that rainfall totaling over an inch between late October and Nov. 2 supported a broad one-category improvement across the Southwest and Great Basin, while remnants of Hurricane Vance aided Texas west and central. Early November storms also helped the Great Plains and Upper Mississippi Valley.
Minnesota stood out. Feed & Grain said the state’s drought footprint dropped from 62.59% to 27.78% after storms dropped an inch and a half or more — amounts the Drought Monitor summary called unusually heavy for early November.
Where drought is getting worse for farms
Farther south and east, the pattern flipped. Feed & Grain said lengthening 30- and 60-day rainfall shortfalls and slipping soil moisture triggered one-category degradations across Kentucky, Indiana, Illinois and Missouri. Kentucky’s drought share rose from 16.25% to 37.02%; Illinois moved from 29.26% to 37.73%. Missouri’s D3–D4 footprint expanded from 16.63% to 21.57%.
The Mid-South remains the core of the worst drought. The official narrative cited multi-inch rainfall shortfalls over the past two months and temperatures running 6–10°F above normal since early September. Exceptional drought now blankets 39.72% of Arkansas and 16.13% of Louisiana, according to Feed & Grain. Mississippi impact notes include pastures rated poor to very poor and farm ponds that have dried up.
River logistics are already feeling it. American Commercial Barge Line began a low-water protocol after the Memphis gauge hit zero on Oct. 25, and a Nov. 2 update said Lower Mississippi tow sizes were trimmed 13% — five barges — Feed & Grain reported.
Crop and livestock exposure
USDA’s weekly Agriculture in Drought summary, cited by Feed & Grain, estimates drought on 19% of corn acres and 28% of soybean acres. Winter wheat and hay each show about 48% of production area in drought, cattle country about 38%. Rice is still the standout at 84% exposure, versus 53% a year earlier.
That mix matters for winter wheat establishment, stock-water and hay stocks going into winter, and for Mid-South rice and pasture operations already under exceptional drought. It is a different problem than the warm-soil nitrogen delay still hanging over parts of the Corn Belt; see our story on waiting for cool enough soils for fall nitrogen.
What the next 10 days look like
The Drought Monitor outlook section expects a much drier multi-day period from Nov. 5–9 for most of the Lower 48, with East Coast rain the main exception. The National Weather Service outlook for Nov. 10–14 leans dry from the northern Plains through the Midwest into New England, with above-normal temperatures nearly nationwide — a pattern the summary linked to strong El Niño conditions.
Oklahoma may see further improvement on next week’s map after Nov. 2 rains are fully assessed, the narrative said.
More weather coverage is in our Weather section. For how dry weather and barge limits can tighten local basis, see also our Nov. 5 briefing.
Frequently asked questions
When was this Drought Monitor map released?
The map released Thursday, Nov. 5, 2026, is valid for conditions as of Nov. 3, 2026.
Did drought improve everywhere?
No. National coverage fell, but Kentucky, Illinois, Indiana, Missouri and parts of the Lower Mississippi Valley saw drought expand or intensify.
Which crop is most exposed right now?
USDA’s Agriculture in Drought summary puts 84% of rice production area in drought, the highest among the major crops listed.
Get the Daily Ag Business Briefing
Markets, policy and farm business in one free email each weekday.