A HERE CITY site

Low-carbon corn and 45Z: How USDA’s updated calculator scores your fields, and the records you’ll need
Green Plains' $325M 45Z credit deal shows low-carbon grain has value. Here's how USDA's FD-CIC v1.2 scores fields, what to record and what to ask buyers.
Key takeaways
- Ethanol maker Green Plains agreed Oct. 30 to sell at least $250 million and up to $325 million of 2026 45Z clean fuel tax credits. Low-carbon fuel is turning into cash.
- For farmers, the entry point is USDA’s Feedstock Carbon Intensity Calculator (FD-CIC) version 1.2. It now scores each field separately and is free to use in a browser.
- For each field you’ll enter this year’s yield, your expected (APH) yield and the synthetic nitrogen applied per acre. Records are subject to third-party audit and must be kept five years.
- Treasury’s final 45Z rules are widely expected next month, Agri-Pulse reported.
The 45Z clean fuel production credit pays biofuel makers more for fuel with a lower carbon score. Some of that score comes from the corn and soybeans they buy, and a deal announced Friday shows how much money is on the table. Below is a plain-English guide to how USDA’s updated calculator scores a field, what records you’ll need, and the questions to ask before you sign a low-carbon grain contract.
The news: a nine-figure credit sale
Omaha-based Green Plains said its buyers committed to purchase a minimum of $250 million in 45Z credits generated in 2026, and as much as $325 million in total, with an option for another $30 million depending on how many credits the plants generate. The company expects $140 million in cash in the fourth quarter for credits produced through June 30. Credits from the second half of the year would be transferred and paid in the first half of 2027, after compliance reporting.
Green Plains said the value rests on its plants’ current carbon intensity (CI) scores. It does not count any further gains from low-carbon initiatives, which the company said could add more credits. “This agreement illustrates the value we’ve built into our low-carbon platform,” CEO Chris Osowski said. Agri-Pulse noted the company also recently launched a “Farm Forward” program to track and reward on-farm practices that cut CI.
Step 1: Run one of your fields through the calculator
USDA released version 1.2 of the FD-CIC on Sept. 11. According to an Oct. 29 analysis by University of Illinois economists in farmdoc daily, it comes as an Excel workbook and as a web tool (usda.gov/usda-fdcic/webtool) that needs no download. The farmdoc authors encourage producers to try it on one field using this year’s yield and nitrogen rate.
For each field, or each group of fields managed the same way (USDA calls these management units), you enter:
- location and acres;
- actual yield and expected yield, which is usually the APH yield from your crop insurance;
- total synthetic nitrogen applied per acre;
- whether you used a cover crop, your tillage system and any nitrification inhibitor, including the share of nitrogen treated; and
- whether manure was applied, with details.
The tool returns a CI score for each management unit. The pilot version produced one whole-farm average. Version 1.2 covers corn, soybeans, sorghum and spring canola. It dropped split in-season and spring-only nitrogen as credited practices, and it added grazed cover crops, manure and the nitrogen rate itself.
Step 2: Understand what moves your score
Several points from the farmdoc analysis matter for management decisions:
- Location sets most of the soil-carbon credit. Cover crop and no-till reductions come almost entirely from soil carbon, which USDA assigns by region (Major Land Resource Area). Neighboring counties in the same region get identical values. Across Illinois counties, those practices averaged reductions of about 1,662 and 1,846 grams of CO2-equivalent per bushel.
- Nitrogen per bushel is the lever you control. The calculator divides synthetic nitrogen by yield and compares the result with USDA’s baseline of about 0.98 pounds per bushel for corn. Using less nitrogen per bushel lowers three fertilizer-related emission terms.
- A bumper crop helps less than you might think. Yield enters only through that nitrogen math, and the yield used is held within 20% of expected yield. The farmdoc authors caution that a CI score won’t fall in step with a yield gain.
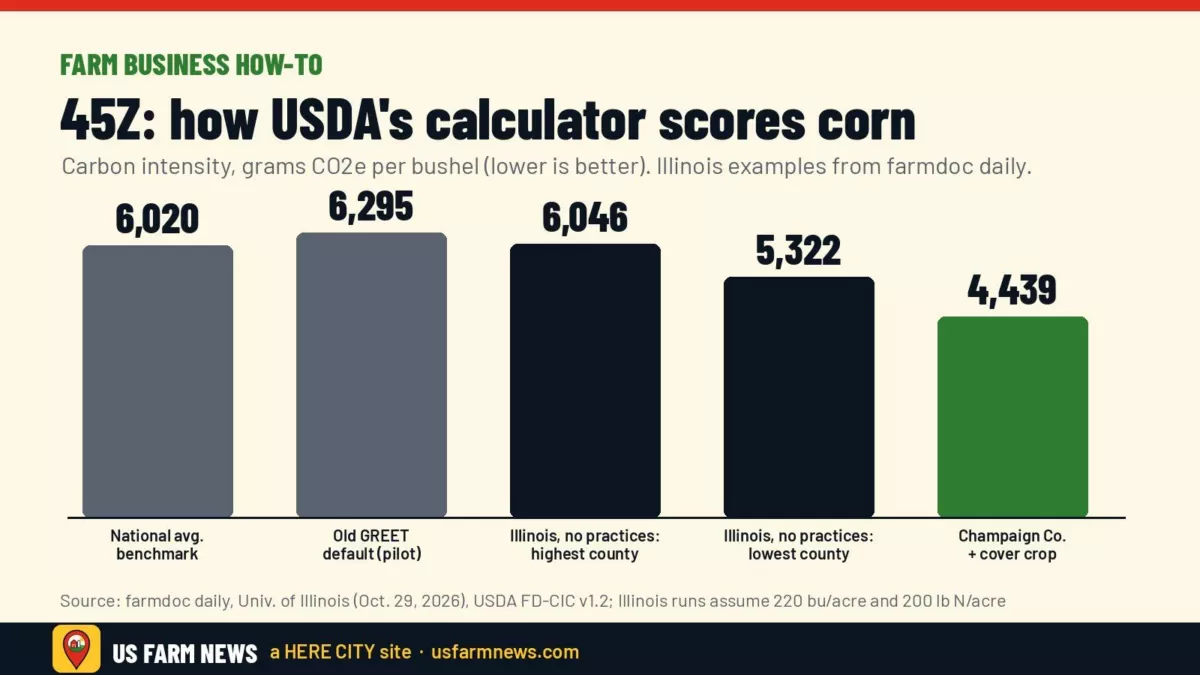
- The benchmark moved. Scores are now measured against an estimated national average: 6,020 g CO2e per bushel of corn, while the soybean benchmark is 7,682. The pilot used a 6,295 GREET default for corn.
To give a sense of scale, the farmdoc authors modeled Illinois corn yielding 220 bushels an acre on 200 pounds of nitrogen. With no practices selected, scores ran from 5,322 to 6,046 depending on the county. Champaign County corn with a cover crop scored 4,439.
Step 3: Build the paper trail now
USDA’s final technical guidelines (91 FR 39334, June 29, 2026) set the standards each practice must meet, covering tillage, cover crops, nutrient management, manure and nitrification inhibitors. Producers must keep records of what they entered in the FD-CIC, what it returned and how each practice was carried out. Third-party accredited verifiers can audit those records, which must be kept for five years, farmdoc said. Records that back up those entries might include:
- fertilizer invoices and application records by field;
- yield maps or scale tickets that tie bushels to fields;
- cover crop seed receipts with planting and termination dates; and
- tillage passes and equipment used.
Treasury has said biofuel producers may use the 2026 version of the calculator for fuel made in both 2025 and 2026 (IRS Notice 2026-53), farmdoc noted.
Step 4: Ask the buyer how you get paid
The tax credit goes to the fuel producer, not the farmer. Any farm-level payment comes through your contract with the ethanol plant, crusher or grain buyer. Before you enroll fields, ask:
- Is the payment a premium per bushel, a per-acre payment or something else, and when is it paid?
- Who runs the calculator and who pays for verification?
- What happens to the premium if Treasury’s final rules change the credit’s value?
- Who owns the field data, and can it be shared or resold?
That last risk is real for plants too. Green Plains’ agreement depends on credits qualifying under the program, and Agri-Pulse reported the industry is still waiting on Treasury’s final rules.
This is general information, not legal, tax or financial advice. Review any contract with your own attorney or tax adviser. For related policy coverage, see our report on the fight over year-round E15 and our Farm Management section.
Frequently asked questions
Do farmers receive the 45Z tax credit directly?
No. The credit goes to the biofuel producer. Farmers can benefit through premiums or payments in contracts with plants or grain buyers that value low-carbon feedstock.
What do I need to use USDA’s FD-CIC?
Field location and acres, actual and expected (APH) yield, total synthetic nitrogen per acre, and your cover crop, tillage, nitrification inhibitor and manure practices.
How long must I keep 45Z records?
Five years. Accredited third-party verifiers can audit your calculator inputs, results and practice records, according to farmdoc daily.
Get the Daily Ag Business Briefing
Markets, policy and farm business in one free email each weekday.